HD Maps
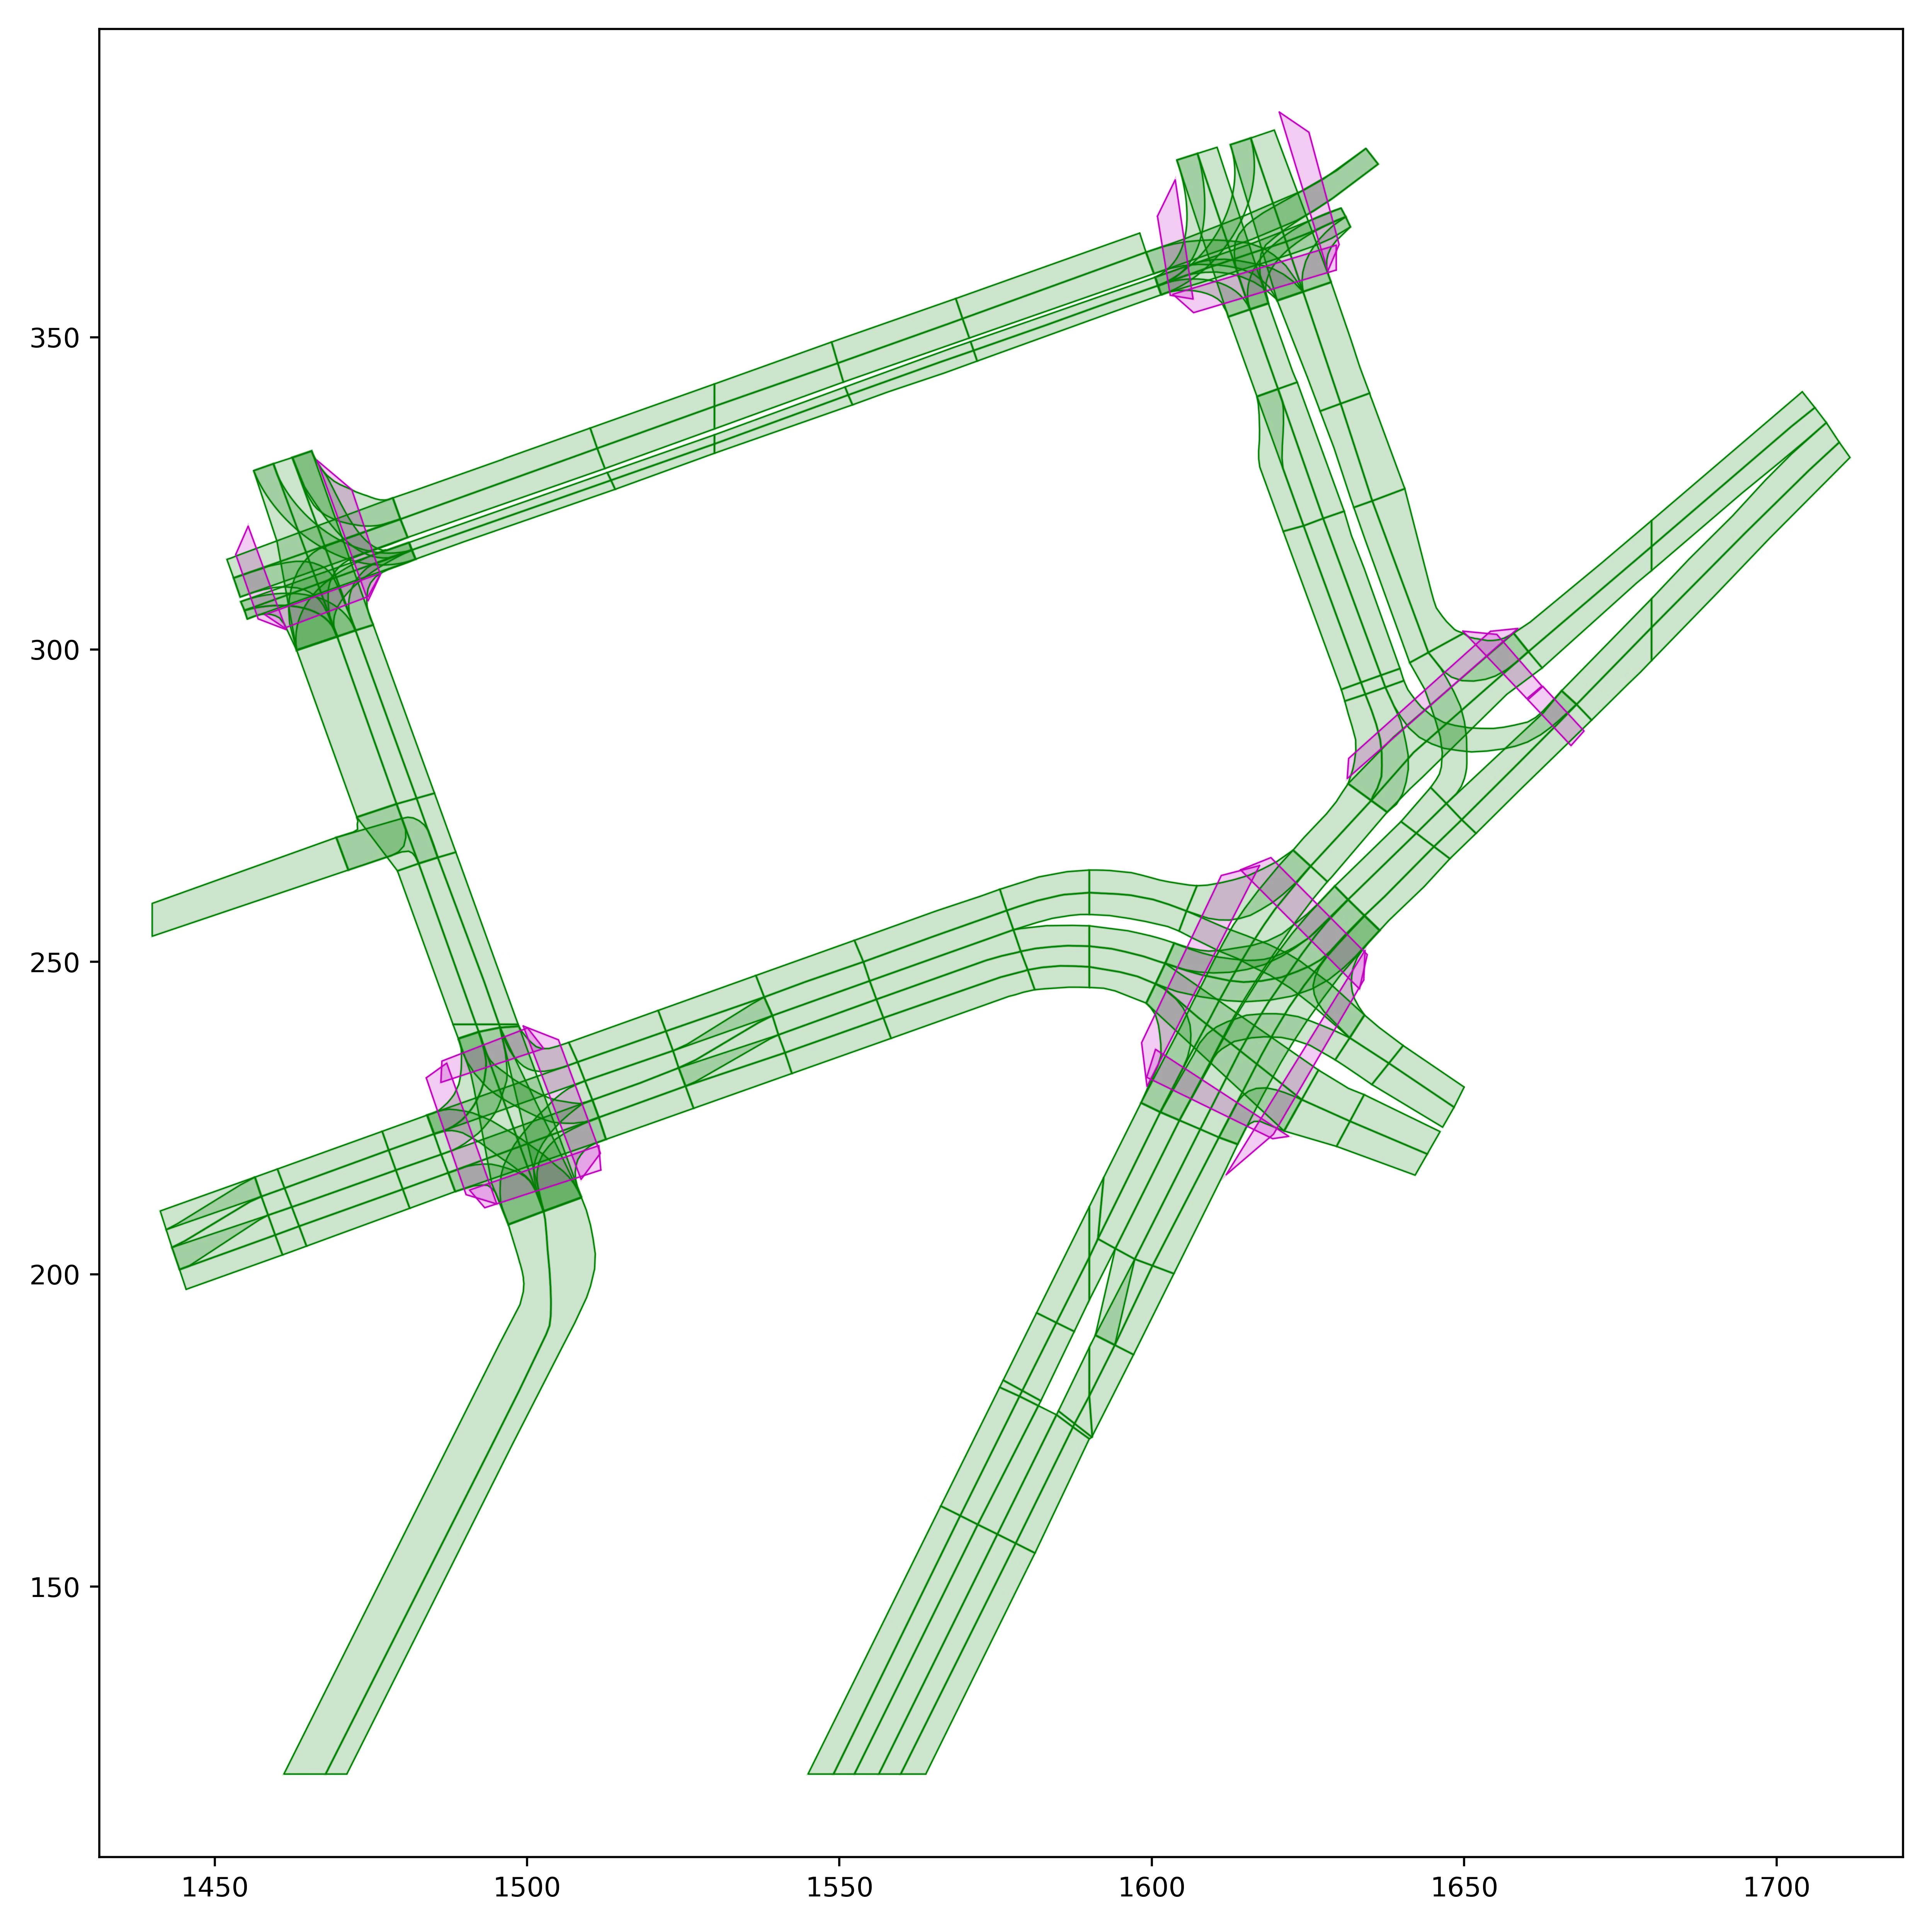
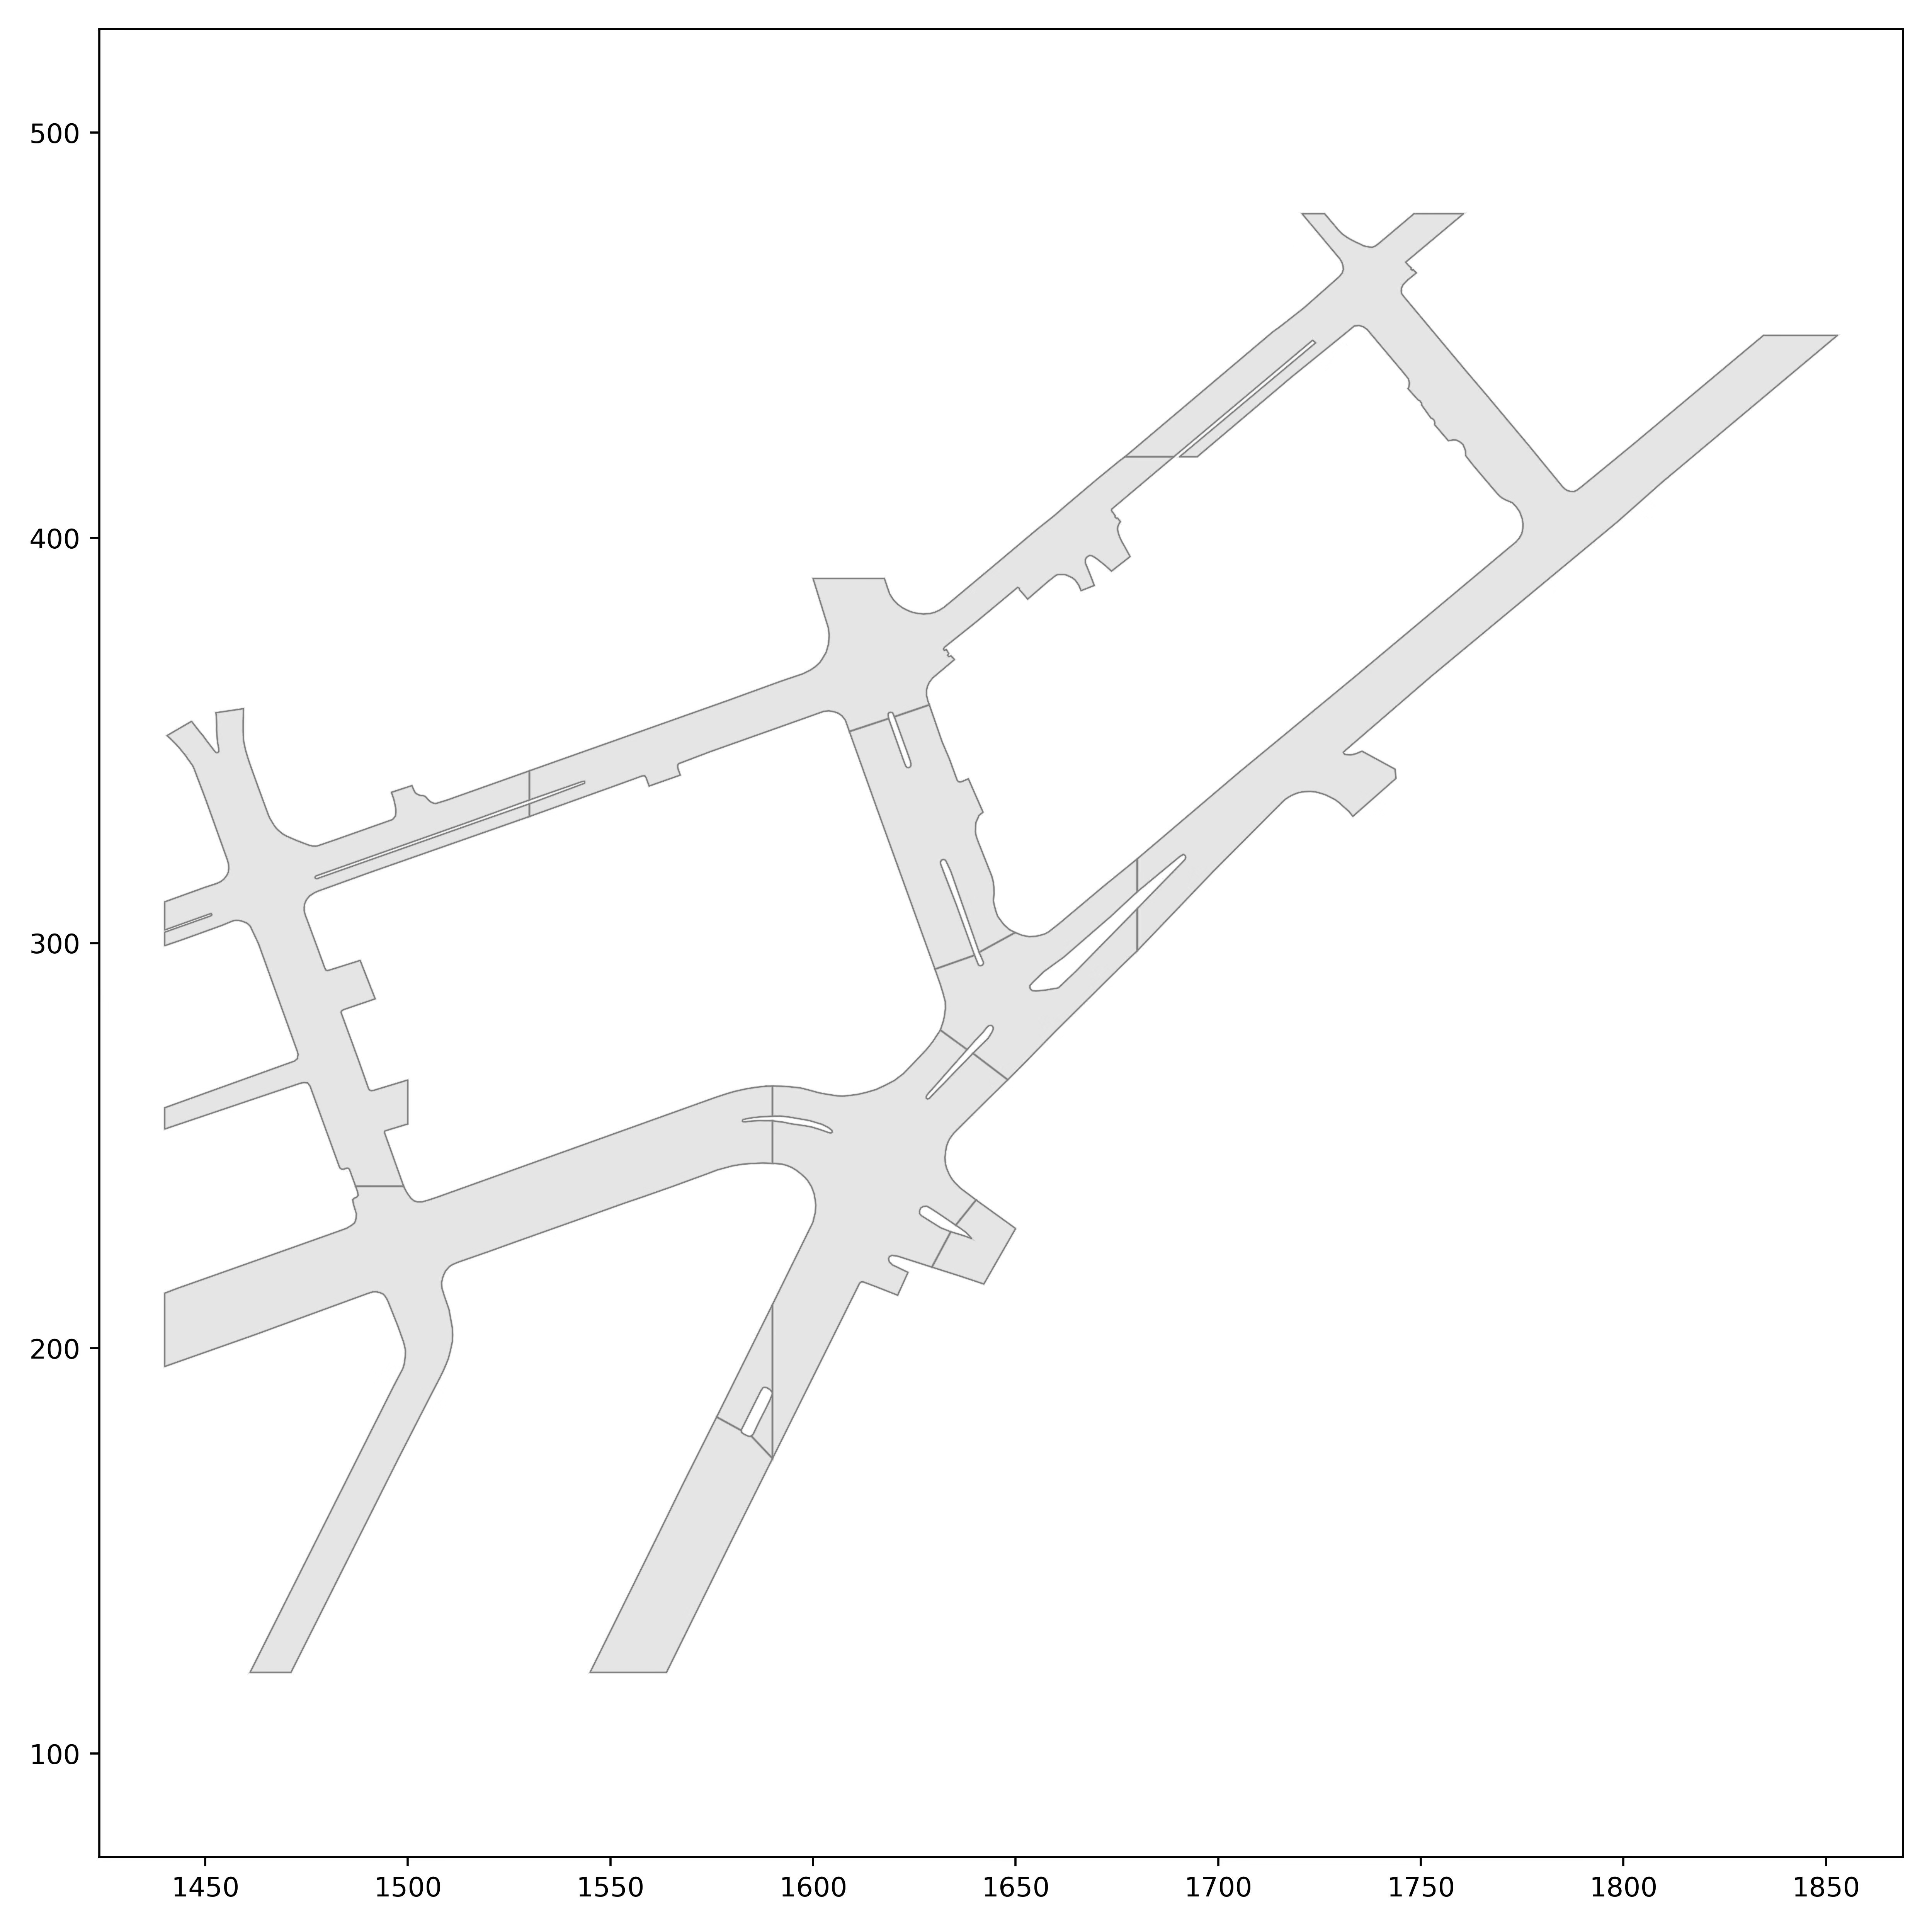
Table of Contents
- Overview
- Map Counts
- Vector Map: Lane Graph and Lane Segments
- Vector Map: Drivable Area
- Vector Map: Pedestrian Crossings
- Area of Local Maps
- Raster Maps: Ground Surface Height
- Training Online Map Inference Models
Overview
In all three datasets, each scenario contains its own HD Map with 3D lane, crosswalk, and drivable area geometry — sourced from data captured in six distinct cities (Austin, Detroit, Miami, Palo Alto, Pittsburgh, and Washington D.C.).
Each scenario in the three datasets described above shares the same HD map representation. Each scenario carries its own local map region. This is a departure from the original Argoverse datasets in which all scenarios were localized onto two city-scale maps. Advantages of per-scenario maps include:
- More efficient queries.
- The ability to handle map changes. A particular intersection might be observed multiple times in our datasets, and there could be changes to the lanes, crosswalks, or even ground height in between the times when the logs or sequences were captured.
Map Counts
Argoverse 2 offers a massive number of highly diverse HD maps:
- Motion Forecasting Dataset: ~250,000 vector maps.
- Sensor Dataset: 1,000 vector maps and 1,000 ground height raster maps.
- LiDAR Dataset: 20,000 vector maps.
- TbV Dataset: 1,038 vector maps and 1,038 ground height raster maps.
The core data structure that holds Argoverse 2 map data is the ArgoverseStaticMap class. Please refer to the map tutorial notebook for more examples of how to use the map API.
Vector Map: Lane Graph and Lane Segments
The core feature of the HD map is the lane graph, consisting of a graph , where are individual lane segments. In the supplemental material, we enumerate and define the attributes we provide for each lane segment. Unlike Argoverse 1, we provide the actual 3D lane boundaries, instead of only centerlines. However, our API provides code to quickly infer the centerlines at any desired sampling resolution. Polylines are quantized to resolution in the release.
These vector map files are provided as JSON, e.g. log_map_archive_00a6ffc1-6ce9-3bc3-a060-6006e9893a1a____PIT_city_31785.json
They may be loaded as follows:
from av2.map.map_api import ArgoverseStaticMap
log_map_dirpath = Path("av2") / "00a6ffc1-6ce9-3bc3-a060-6006e9893a1a" / "map"
avm = ArgoverseStaticMap.from_map_dir(log_map_dirpath=log_map_dirpath, build_raster=False)
Please refer to the LaneSegment class, with the following attributes:
id: unique identifier for this lane segment (guaranteed to be unique only within this local map).is_intersection: boolean value representing whether or not this lane segment lies within an intersection.lane_type: designation of which vehicle types may legally utilize this lane for travel (seeLaneType).right_lane_boundary: 3D polyline representing the right lane boundary (seePolyline).left_lane_boundary: 3D polyline representing the left lane boundary.right_mark_type: type of painted marking found along the right lane boundary (seeLaneMarkType).left_mark_type: type of painted marking found along the left lane boundary.predecessors: unique identifiers of lane segments that are predecessors of this object.successors: unique identifiers of lane segments that represent successor of this object. Note: this list will be empty if no successors exist.right_neighbor_id: unique identifier of the lane segment representing this object’s right neighbor.left_neighbor_id: unique identifier of the lane segment representing this object’s left neighbor.
Vector Map: Drivable Area
Instead of providing drivable area segmentation in a rasterized format, as we did in Argoverse 1, we release it in a vector format (i.e. as 3D polygons). This offers multiple advantages, chiefly in compression - allowing us to store separate maps for tens of thousands of scenarios, while ensuring that the raster format is still easily derivable. The polygon vertices are quantized to 1 cm resolution.
Please refer to the DrivableArea class, with the following attributes:
id: unique identifier.area_boundary: 3D vertices of polygon, representing the drivable area’s boundary.
Vector Map: Pedestrian Crossings
These entities represent crosswalks, and are provided in vector format. They are parameterized by two edges along a principal axis. Both lines should be pointing in nominally the same direction and a pedestrian is expected to move either roughly parallel to both lines or anti-parallel to both lines.
Please refer to the PedestrianCrossing class, with the following attributes:
id: unique identifier of pedestrian crossing.edge1: 3D polyline representing one edge of the crosswalk, with 2 waypoints.edge2: 3D polyline representing the other edge of the crosswalk, with 2 waypoints.
Area of Local Maps
Each scenario’s local map includes all entities found within a dilation in -norm from the ego-vehicle trajectory.
Raster Maps: Ground Surface Height
Only the AV2 Sensor Dataset and TbV includes a dense ground surface height map. (The AV2 LiDAR dataset and AV2 Motion Forecasting (MF) datasets do not come up with raster maps, but still have sparse 3D height information on polylines).
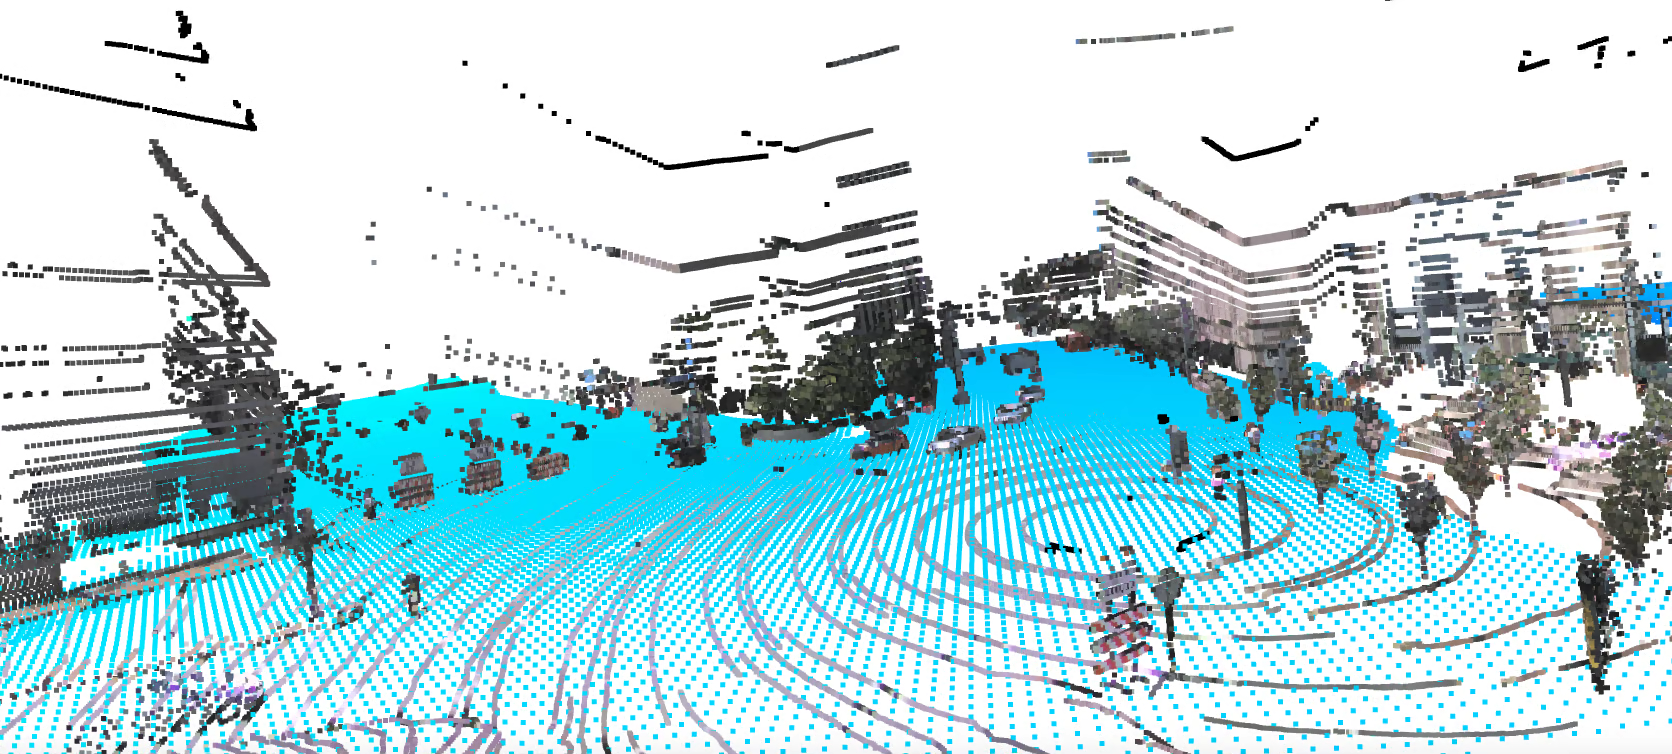
Ground surface height is provided for areas within a 5 m isocontour of the drivable area boundary, which we define as the region of interest (ROI). We do so because the notion of ground surface height is ill-defined for the interior of buildings and interior of densely constructed city blocks, areas where ground vehicles cannot observe due to occlusion. The raster grid is quantized to a 30 cm resolution, a higher resolution than the 1 m resolution in Argoverse 1.
This data is provided as float16 Numpy files:
00a6ffc1-6ce9-3bc3-a060-6006e9893a1a_ground_height_surface____PIT.npy
Sim(2) representation: In order to access the raster values, a Similarity(2) mapping from city coordinates to the high-resolution raster grid (which we refer to as img or array). This Similarity(2) object provided as a JSON file per log encapsulating (R,t,s), e.g.:
00a6ffc1-6ce9-3bc3-a060-6006e9893a1a___img_Sim2_city.json
Points may be transformed as follows:
from av2.geometry.sim2 import Sim2
array_Sim2_city = Sim2.from_json(json_fpath)
points_array = array_Sim2_city.transform_from(points_city)
However, instead of indexing manually into the raster arrays, the API will handle this for you:
avm = ArgoverseStaticMap.from_map_dir(log_map_dirpath=log_map_dirpath, build_raster=True)
points_z = avm.raster_ground_height_layer.get_ground_height_at_xy(points_xy)
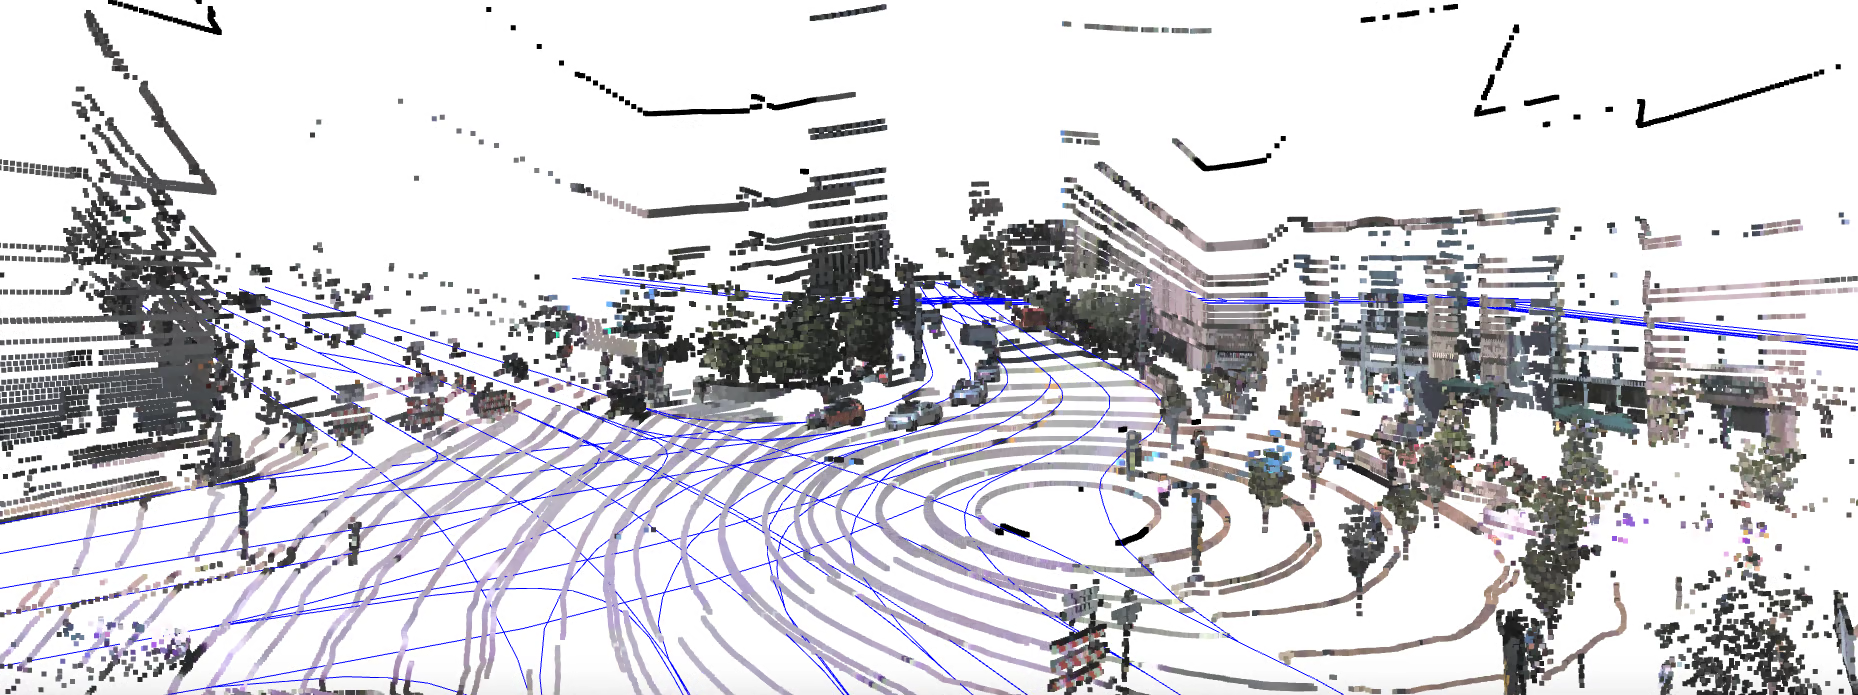
Training Online Map Inference Models
Argoverse 2 offers new opportunities for training online map inference models, as the largest source of paired sensor data and HD maps publicly available at the time of release.
However, a few Sensor Dataset logs intentionally feature HD map changes:
75e8adad-50a6-3245-8726-5e612db3d16554bc6dbc-ebfb-3fba-b5b3-57f88b4b79caaf170aac-8465-3d7b-82c5-64147e94af7d6e106cf8-f6dd-38f6-89c8-9be7a71e7275
These logs should not be used for training online map inference models, as the real-world scene has recently been updated via constructed, leaving the map out-of-date.