Introduction
Argoverse 2 is a collection of open-source autonomous driving data and high-definition (HD) maps from six U.S. cities: Austin, Detroit, Miami, Pittsburgh, Palo Alto, and Washington, D.C. This release builds upon the initial launch of Argoverse, which was among the first data releases of its kind to include HD maps for machine learning and computer vision research.
Argoverse 2 includes four open-source datasets:
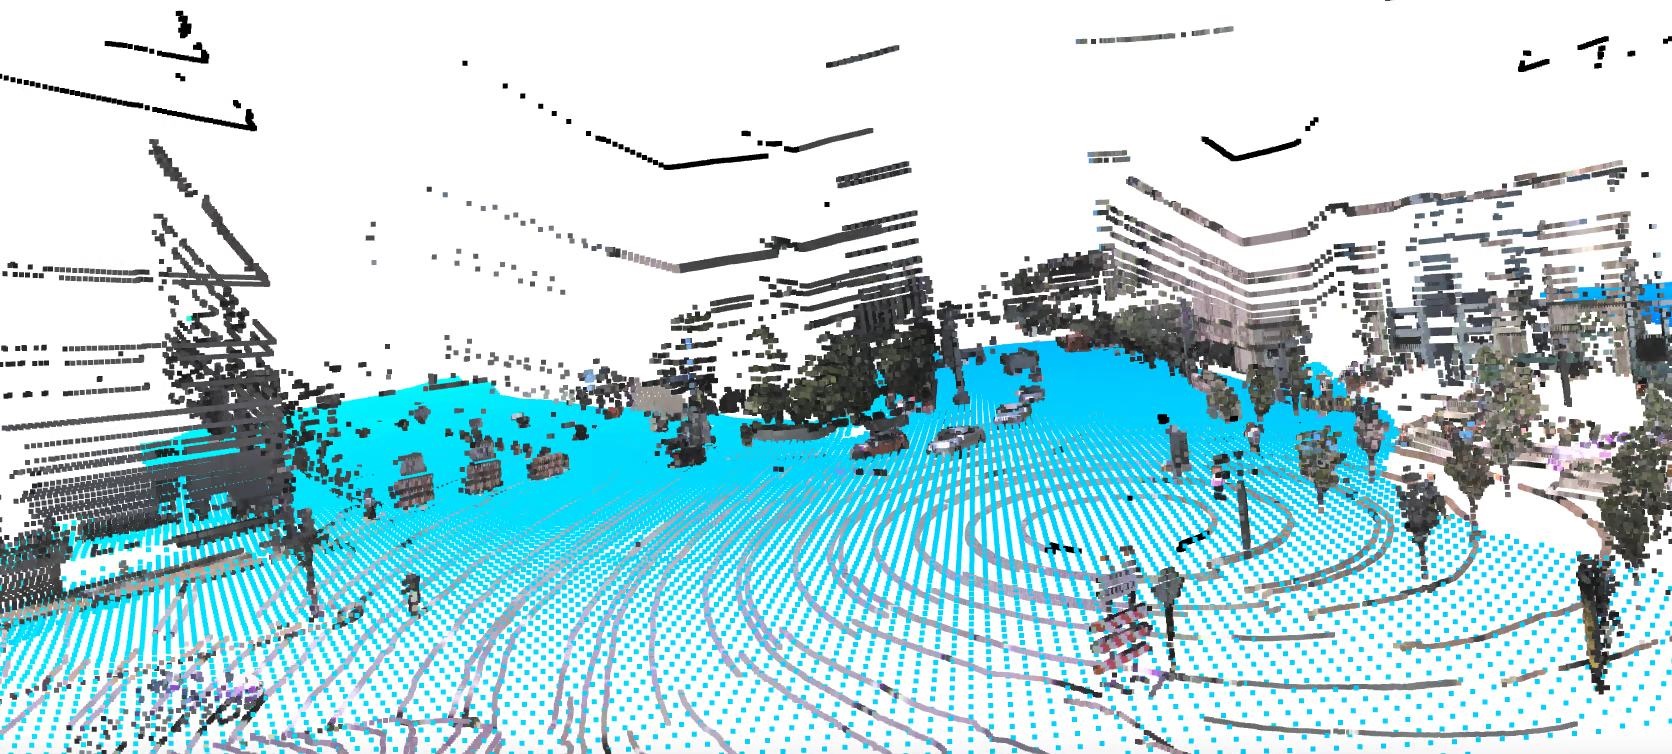
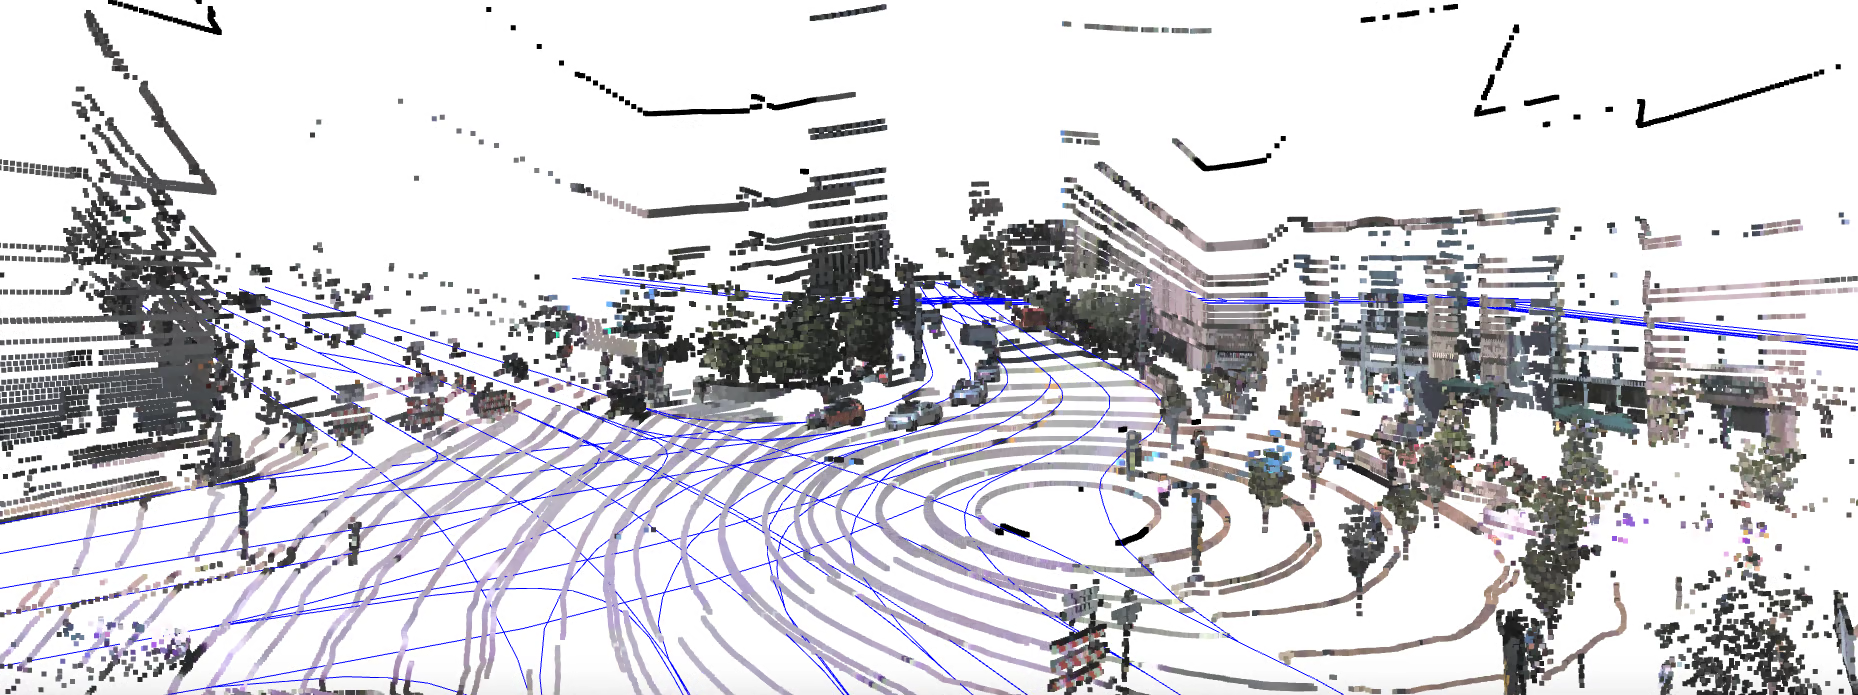
- Argoverse 2 Sensor Dataset: contains 1,000 3D annotated scenarios with lidar, stereo imagery, and ring camera imagery. This dataset improves upon the Argoverse 1 3D Tracking dataset.
- Argoverse 2 Motion Forecasting Dataset: contains 250,000 scenarios with trajectory data for many object types. This dataset improves upon the Argoverse 1 Motion Forecasting Dataset.
- Argoverse 2 Lidar Dataset: contains 20,000 unannotated lidar sequences.
- Argoverse 2 Map Change Detection Dataset: contains 1,000 scenarios, 200 of which depict real-world HD map changes.
Argoverse 2 datasets share a common HD map format that is richer than the HD maps in Argoverse 1. Argoverse 2 datasets also share a common API, which allows users to easily access and visualize the data and maps.
Where was the data collected?
The data in Argoverse 2 comes from six U.S. cities with complex, unique driving environments: Miami, Austin, Washington DC, Pittsburgh, Palo Alto, and Detroit. We include recorded logs of sensor data, or “scenarios,” across different seasons, weather conditions, and times of day.
How was the data collected?
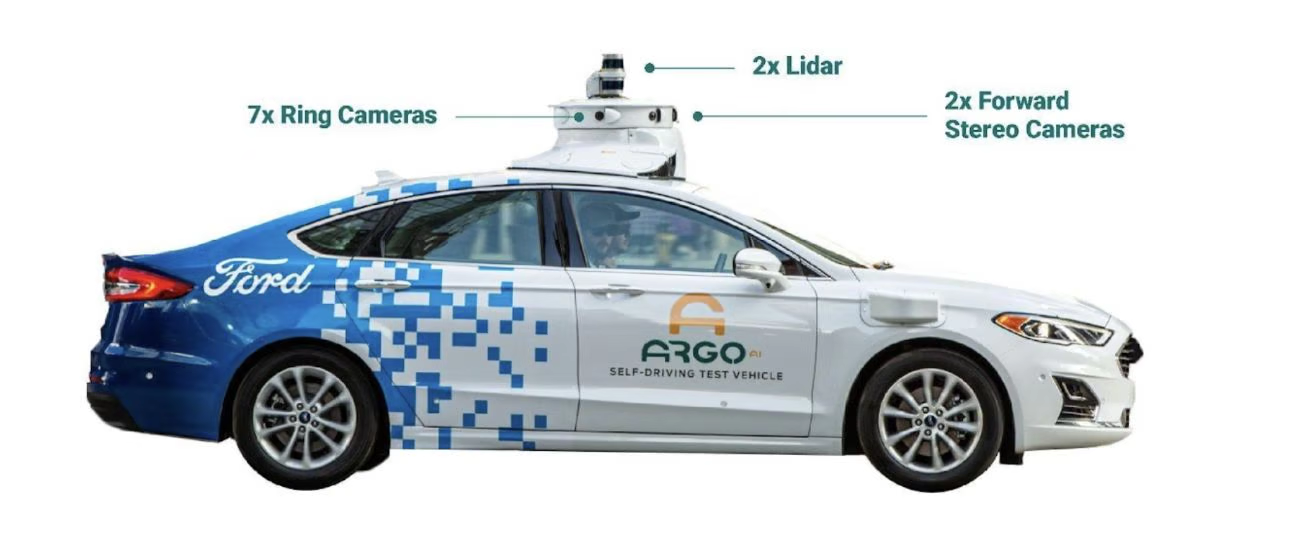
We collected all of our data using a fleet of identical Ford Fusion Hybrids, fully integrated with Argo AI self-driving technology. We include data from two lidar sensors, seven ring cameras, and two front-facing stereo cameras. All sensors are roof-mounted:
Lidar
- Two roof-mounted VLP-32C lidar sensors (64 beams total)
- Overlapping 40° vertical field of view
- Range of 200 m
- On average, our lidar sensors produce a point cloud with ~ 107,000 points at 10 Hz
Cameras
- Seven high-resolution ring cameras (2048 width x 1550 height) recording at 20 Hz with a combined 360° field of view. Unlike Argoverse 1, the camera and lidar are synchronized. The camera images are captured as one of the two lidars sweep past its field of view. The front center camera is portrait aspect ratio (1550 width x 2048 height) to improve the vertical field of view.
- Two front-view facing stereo cameras (2048 x 1550) sampled at 20 Hz
Localization
We use a city-specific coordinate system for vehicle localization. We include 6-DOF localization for each timestamp, from a combination of GPS-based and sensor-based localization methods.
Calibration
Sensor measurements for each driving session are stored in “scenarios.” For each scenario, we provide intrinsic and extrinsic calibration data for the lidar and all nine cameras.
Argoverse 2 Maps
Each scenario is paired with a local map. Our HD maps contain rich geometric and semantic metadata for better 3D scene understanding.
Vector Map: Lane-Level Geometry
Our semantic vector map contains 3D lane-level details, such as lane boundaries, lane marking types, traffic direction, crosswalks, driveable area polygons, and intersection annotations. These map attributes are powerful priors for perception and forecasting. For example, vehicle heading tends to follow lane direction, drivers are more likely to make lane changes where there are dashed lane boundaries, and pedestrians are more likely to cross the street at designated crosswalks.
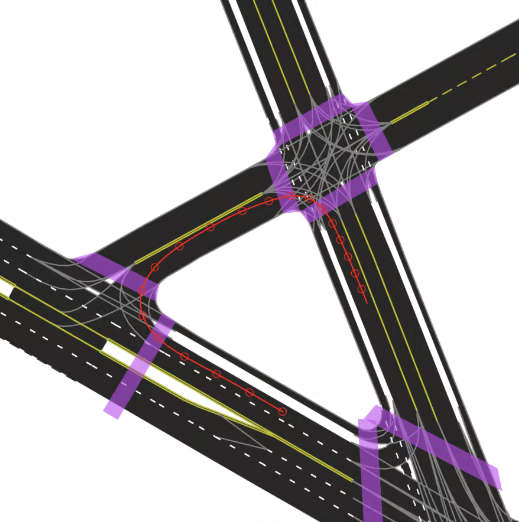
An example of an HD map for an Argoverse 2 scenario. This map format is shared by the Sensor, Lidar, Motion Forecasting, and Map Change datasets. This figure shows a rendering of the “vector” map with polygons and lines defining lanes, lane boundaries (dashed white, dashed yellow, double yellow, etc), and crosswalks (purple). Implicit lane boundaries, such as the corridor a vehicle is likely to follow through an intersection, are shown in gray. The path of the ego-vehicle is shown in red.
Raster Map: Ground Height
To support the Sensor and Map Change datasets, our maps include real-valued ground height at thirty centimeter resolution. With these map attributes, it is easy to filter out ground lidar returns (e.g. for object detection) or to keep only ground lidar returns (e.g. for building a bird’s-eye view rendering).